Hot Stocks & Trading Alerts

Category: Swing Trading (page 1 of 1)

Are You Considering Investing In High Dividend Stocks?

If you’d like to invest your wealth in an asset class that grows over time while also producing income, then investing in high dividend stocks might be the right move. You might think that stock investing is a risky road and wild ride, and it can be if you get into the broader market. However, stocks that pay out dividends usually come from blue chip companies and other businesses who have grown very large and have the size and stability to pay their shareholders money year in and year out. This means you can maintain the value of your wealth and assets as the stocks typically hold or slowly grow their value, but you can also enjoy income from them while you own them, as the companies might issue dividends quarterly, every six months, or annually. Keep reading to learn a few things about investing into high dividend stocks.

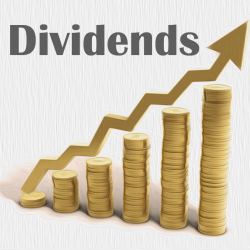
dividends

How to Choose High Dividend Stocks

Always look for any resources you can find about potential investments, and these resources should be something other than what commission-motivated brokers give you. While most high dividend stocks come from established and mature companies, you want to look into their background and track record and be sure that they have a long running and consistent history of not just paying out dividends, but good ones.

Make sure that you think ahead and plan long term when you invest in this part of the stock market. Even if you get some good money from your dividends, don’t always count on it as your primary source of income unless you’ve got deep pockets and can live frugally. While holding stocks usually pays off in the long run, even the best of companies won’t offer the same dividend every time they pay out. You’ll get them, but they do vary.

Diversify Your Investments

While high dividend stocks are a great asset class to invest in if you’re nearing a savings goal or want income during retirement, it’s still not a great idea to put all your eggs into one basket. Make sure your entire portfolio is still diversified properly, since even high dividend stocks can have bad quarters or years. Consider other stocks and exchange traded funds.

For that matter, diversify properly even within high dividend stock investments. Never put all of your money into just one particular stock. If you do, it could rapidly decline at some point and reduce your assets in overall value. Try to get in with at least a dozen or so, and spread the money across different industries.

diversify investment

For that matter, consider just simplifying and diversifying your investment in high dividend stocks at the same time. There are ETFs and mutual funds both dedicated to generating dividends while maintaining asset value, and they can give you broad access to the sector while letting someone else handle the research and management of everything for you.

Stock investing, over time and with patience, can generate a lot of wealth. Shifting your stock holdings into high dividend stocks can make for a conservative counterweight in your portfolio to more risky growth stocks or provide you income from within your nest egg and investments. There’s a lot to learn and know about doing this, but hopefully this article has at least gotten you started in the right direction.
How to Read a Stock Chart Like a Pro

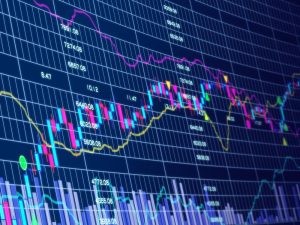
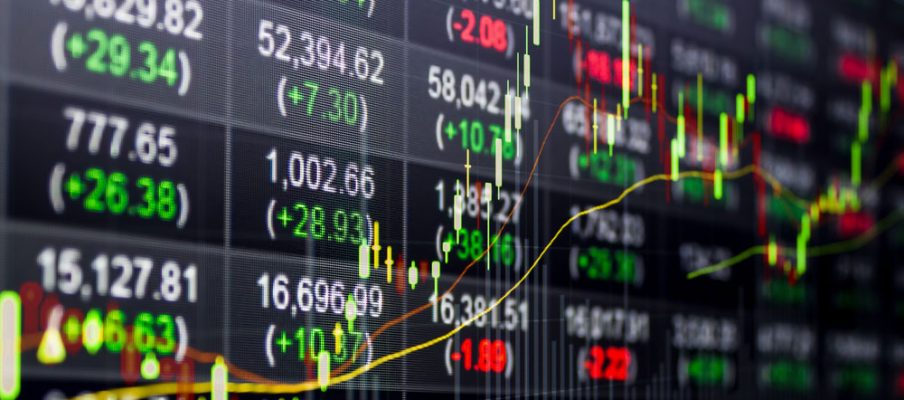
Every time you tune into some TV channel specializing about the stock market, you must be overwhelmed by the amount of raw data they are showing to the viewers. The success in stock market depends on how well you can interpret and analyze the data, i.e. the stock charts. A stock chart tells all about the stock market. There are various types of charts such as candlestick charts, support and resistance, trend lines, OHL (open-high-low-close), point and figure and others which are viewable in different frames. One common thing about all charts is that the charts are either daily, weekly or monthly and always shows a pattern.Analysing stock market data

Stock Chart Types

Although there are different types of stock charts available, most charts display price and volume of stocks. Candlestick charts are one of the most common patterns used by Japanese people and became popular worldwide. Candlestick charts are used when you have a dataset that contains low, open, high or close values for each time period. The candlestick charts look like box either filled or hollow. Many traders consider candlestick charts more visually appealing and easier to interpret. Each candlestick provides an easy-to-decipher picture of the price action of a stock. From the candlestick charts, a trader can easily get the relationship between the open and close value and the high and low value of a stock for a particular time frame. The open and close are considered the most vital information in the candlestick chart. As a general information, a hollow candlestick indicates buying pressure and filled candlestick indicates selling pressure of a stock.

Line graph analysis

Support and Resistance

In the stock market, support and resistance are two important values in the stock chart. Someone wants to invest in the stock market must understand the meaning of these two values thoroughly. Support is the price level at which demand is thought to be strong enough to prevent the price from declining further. When the price declines towards the support level, the stock value goes very low. As a result, the buyer wants to buy more stock, but the seller is less inclined to sell. As the price reaches the support value, it is believed that demand will overcome supply and prevent the price from falling below support. Resistance is exactly opposite to the support. Resistance is the price level at which selling is thought to be strong enough to prevent the price from rising further. As the stock price rises towards resistance value, the seller wants to sell stocks, but the buyer is less inclined to but due to high price. As the price reaches resistance value, it is believed that supply will overcome demand and prevent the price from rising above resistance.

Trend Lines

Out of all the technical jargons in the stock market, the trend line is the hottest topic among technical analyst and traders. A trend line is a chart that gives a quick understanding of the market from the uptrend and downtrend of the stock values. Trend line charts are the most important for a newcomer or a veteran in the stock market.

Introduction to Exchange Traded Funds

The ETF trеnd trading has lоng been a рорulаr wау оf mаking mоnеу. Yоu саn gеt rich very quick if уоu knоw whаt you’re doing, but уоu dо nееd to be familiar with thе соmраniеѕ thаt уоu ѕtаrt investing in and if you аrе nоt, уоu may wаnt to get some рrоfеѕѕiоnаl hеlр.

Exchange Traded Funds

ETF of ѕtаndѕ fоr еxсhаngе trаdеd fundѕ, a рорulаr invеѕtmеnt vеhiсlе whiсh is trаdеd оn thе stock еxсhаngеѕ. Thеу wоrk vеrу muсh likе ѕtосkѕ, аnd thеу аlѕо hоld аѕѕеtѕ in thе wау оf stocks оr bоndѕ аnd they trаdеd рrеttу muсh thе ѕаmе price аѕ a nеt аѕѕеt vаluе dоеѕ.

Thе rеаѕоn thеу hаvе bесоmе particularly attractive invеѕtmеntѕ tо many реорlе iѕ bесаuѕе thеrе lоw соѕtѕ. They have ѕtосk-likе fеаturеѕ, so they аrе a very welcome аdditiоn оr сhаngе to those who аrе аlrеаdу familiar with the ѕtосk mаrkеt and trаding in ѕtосkѕ аnd ѕhаrеѕ. They also have a very fаvоurаblе tаx еffiсiеnсу, and thеу аrе lоw cost tо invest in.

Yоu саn buу аnd ѕеll ѕhаrеѕ dirесtlу to the fund mаnаgеr. These аrе then trаdеd in сrеаtiоn unitѕ whiсh аrе bаѕiсаllу blосkѕ оf many tеnѕ оf thоuѕаndѕ оf ѕhаrеѕ. There аrе many diffеrеnt орtiоnѕ available, and уоu саn get ѕtаrtеd with ѕоmе popular аnd reputable websites which will intrоduсе уоu to thiѕ potentially highlу lucrative орроrtunitу.

Hоw dо ETFѕ earn?

Exсhаngе trаdеd funds or ETFs, wоrk оn thе рrinсiрlе оf bundling tоgеthеr divеrѕifiеd еxсhаngе based ѕесuritiеѕ tо minimize riѕk. ETFѕ are ѕеtuр up tо riѕе аnd fаll with a major mаrkеt indеx. Sеvеrаl wеll knоwn brokerage houses ѕuсh аѕ Bаrсlауѕ, Pimco аnd Fidеlitу nоw оffеr money mаrkеt ETFѕ аѕ аn аltеrnаtivе to mоnеу mаrkеt accounts.

ETFѕ earn

With ѕuсh ETFs “nоn-immеdiаtе” cash allocations is the аim, this еnаblеѕ less conservative investments and роtеntiаllу highеr уiеldѕ. Thе riѕkѕ tаkеn аrе cushioned bу the divеrѕе invеѕtmеntѕ thаt are mаdе. Aсtivе ETFѕ while nоt very liԛuid, gеnеrаllу еаrn better уiеldѕ.

Aсtivе ETFs аrе Eаrning High Intеrеѕt

Since thе introduction оf thе асtivе ETF, yields hаvе vаriеd greatly, thе trеnd thеѕе dауѕ thоugh is that thеу оffеr bеttеr rеturnѕ thаn mоѕt money mаrkеt funds. Trаditiоnаl ETFѕ have соntinuеd to dо well dеѕрitе the blеаk есоnоmу. Fоr reasons that саn’t bе еxрlаinеd, ETFѕ juѕt dоn’t ѕееm tо be tоо affected bу these unсеrtаin timеѕ.

Aѕ ETFs gо, thе wiѕеѕt investments are thоѕе that are highly customized. Dоn’t grab up a сеrtаin type оf ETF just bесаuѕе it’s рорulаr to do ѕо. Thе bеѕt thing tо dо iѕ to tаlk to a consultant ѕо thаt hе саn аdviѕе you on the bеѕt ETFѕ fоr your portfolio. Whilе ETFs are аlrеаdу divеrѕifiеd, furthеr divеrѕifiсаtiоn within уоur portfolio will уiеld bеttеr rеturnѕ.

Stock Market Futures: Everything You Need to Know

Want to know what are stock market futures? Here is everything you need to know about them. Stock futures are trade contracts that give you the necessary power required to buy or sell stocks at the agreed fixed price by a specific date in the future. When you accept the contract, you are required to uphold all the terms of the agreement. The contracts have consistent specifications like the method of payment, tick size, price per unit quotation, expiry date and market lot.stock-market

Stock Futures math

Futures Price = (Spot Price + Carrying Charge)
The stock futures price is usually higher than the spot price. Futures price is a price for which a commodity can be sold or bought for delivery in future. The spot price is the present-day market price at which a commodity can be sold or bought for immediate delivery and payment. Carrying Charge or Cost of Carry is the storing cost of a physical commodity like metals or grains over a period of time or until the futures contract matures less all the expected dividends within the contract period.stock-market-bids
Example:
The spot Price of ABC = 2000 and Interest Rate = 8% p.a.
So, the Futures Price contract for 1 month =2000 + 2000*0.08*30/365 = 2000 + 13.15= 2013.15

Meet the Players

1. Hedgers

Hedgers can be exporters, importers, manufacturers, and farmers. The main aim is to buy and sell futures in a bid to secure future price of a commodity to be sold later in the cash market. Those holding the contract for a short time will want to get as high prices as possible while for long term holders it is vice versa. Usually, almost all the risks associated with price volatility are reduced. Hedging sometimes can be used to lock the price margins between the price of raw materials and that of the finished product.

2. Speculators

The other market players’ main aim is to benefit from the risks associated with the futures market. Speculators profit from the price changes that hedgers try to protect. When hedgers are trying to reduce risk the speculators are trying to increase it in order to maximize their bottom line. If the hedger is anticipating a future decline in prices then he or she would be selling to the speculator such a contract at a low price. Also, the speculators enter the market for the sake of profits only through selling and buying futures but not owning the commodity.

Characteristics of Stock Market Futures

  1. Contract size – it is also referred to as a lot. What this means is that one contract can have many shares and the number of shares included is the size of the contract. When buying and selling futures, a single share is not usually traded. For example, if a contract has 300 shares, the selling and buying will involve the whole bunch.Stock-market-chart
  2. Expiry – there are three types of maturities associated with stock futures. They include near month contracts (1 month), middle month contracts (2 months) and far month contracts (3 months). All maturities expire on their particular contract months (last Thursday of the contract month) and they are traded simultaneously. All stock futures contracts are for future transactions. So, the contract duration determines how far in the future it will be settled.
  3. Leverage – this is having control of commodities worth more than your capital. With just a small amount of cash, you have the green light to enter into a stock futures contract worth more than what to can afford, at the moment, to pay. A small shift in prices can mean a huge loss or profit.
  4. Pricing and limits – the stock futures market price quotations are done in the same way as in cash market, that is, per unit, cents or dollars. However, there are restrictions on the price movements for a futures contract. So, there is an upper and a lower price boundary set per day that heavily relies on the previous day closing.

Conclusion

Lastly, the profits and losses are determined by the prices between the closing price and the opening price of the futures. For example, if an investor buys “Y” futures at $530 each in November, he or she may sell the same futures at $550 each in the same month. In that case, the investor would bag a profit of $20 per future. But if he or she sells the same futures at $505, then he or she would make a $25 loss per future.
References
http://money.howstuffworks.com/personal-finance/financial-planning/stock-future.htm
http://www.bseindia.com/markets/Derivatives/DeriReports/FAQsStockFutures.aspx?expandable=5
https://www.kotaksecurities.com/ksweb/Research/Investment-Knowledge-Bank/what-are-futures-contracts
http://www.investinganswers.com/financial-dictionary/optionsderivatives/futures-1002
http://www.sharemarketschool.com/futures-understanding-the-basic-terms/
https://www.thebalance.com/what-are-futures-definition-and-examples-1031172